
2023-09-08
The x-ray database for a regional dental chain was acutely unresponsive almost daily. The problem was increasingly disruptive and the software vendor of no help in resolving it. I was left to diagnose and work around the issue myself. The problem, although uncomplicated, demonstrates how naive database indexing can reinforce performance pathologies.
Relational database indexing
Basic indexing knowledge is recommended. For an introduction to how tables and indexes logically work, see this excellent illustrated article on the SQLite website.
A central SQL Server database is used for about a dozen locations with a few hundred users. The database is small, on the order of one million images - a dozen or two images per patient, times about 50,000 patients. SQL data was a few GiB in size. The application was used remotely, but the DB communicated only with clients in a colocated remote desktop environment, never across sites restricted by bandwidth or latency. The installation had been expanded with additional clinics over several years.
The problem appeared suddenly, with the database unresponsive for everyone. Small business medical software lacks fault tolerance; Most errors cause locking up or crashing. In the present issue problems included a GUI pane in a patient chart module becoming unresponsive, crashing the chart, as well as timeouts in a component responsible for copying newly-captured images from the remote office into the central database. Staff saw workstations lock up and new x-rays disappear.
When freezing occurred, the database server showed high CPU usage. Restarting once or twice made the issue go away, but it soon became a frequent disruption. The problem appeared not necessarily at usage peaks, but particular times of day, usually right in the morning or shortly after lunch.
The imaging database is uncomplicated; four tables are relevant to the present issue:
Visual refers to an individual x-ray, photo, or video; I
will call it the image table. There are indexes on all ID columns
used for joining these tables, to rapidly find e.g. all studies
belonging to a given patient. One particular index was problematic and
will be discussed below.
The DICOM schema
The patient-study-series-instance schema comes from the DICOM standard for imaging data exchange. The present application is not really DICOM-oriented - it's only used for an add-on export/import module - but the schema represents a good default for a medical imaging product.

DICOM data example, showing tree structure. Image from Alexander Weston.
The application does not expose this model to the user in its standard mode, which predates DICOM functionality. In practice, each image tends to get entered as a separate "study" with no grouping, causing scattered data exports. For the present issue, the effect is to require more rows be joined for every listing of a patient's images, as if each image had been saved to a separate folder.
A top queries report showed the server spending almost all of its time on one query. Each execution took an average of 231ms, but it was performed many times a second, exhausting all resources:
Image polling query
WITH
  PatientVisuals as (
    SELECT
      Visual.VisualID as VisualID
    FROM
      visual,
      study,
      series
    WHERE
      Visual.RemovedDate is NULL
      AND study.PatientID     = @patientID
      AND study.StudyRecordID = series.StudyRecordID
      AND series.SeriesID     = Visual.SeriesID
  )
SELECT
  COUNT(1)
FROM
  Visual,
  PatientVisuals
WHERE
  Visual.VisualID = PatientVisuals.VisualID
  AND Visual.ModifiedDate > @ModifiedDate
Query parameters highlighted.
(The query joins the same table
twice, but that's not the current problem.)
I dislike how this query is written, but what it's doing is counting how many images a patient has since a given time. The server profiler shows these queries coming from the "chart" client:
Query in SQL Server Profiler
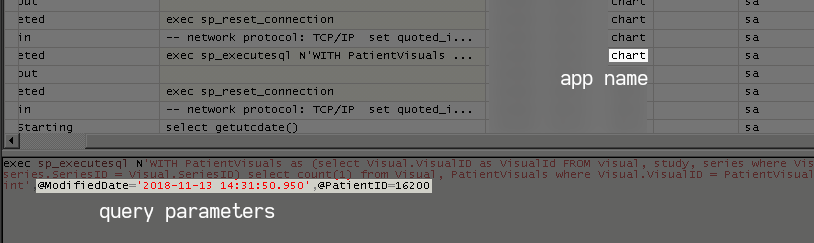
Profiler shows source application and actual arguments.
The chart module is GUI plug-in for the patient chart window of a separate records application, showing the active patient's images, and launching the full imaging program when clicked.
Medical imaging software integration
Patient charting and imaging tend to be separate products and databases, awkwardly tied together with bridging plugins, screen-scraping tools, and toolbar buttons. Chaos results from breakdowns of the keying relationship associating records in one application with another, such as from patients changing their name or other metadata.
The imaging vendor discussed here once attempted to renumerate and merge independent branch office instances of their application into a central database as the corresponding patient records software was similarly centralized. The effort was unsuccessful, with patients lost or duplicated, and images going into the wrong charts. Consequently we had to preserve the old databases for archival purposes.
The chart plugin was continuously polling the database for images newer than the most recent one it had seen. Polling is common for older dental applications; Earlier in their life these lacked active server components and communicated through shared data folders. A previous version of the imaging application similarly lacked a SQL database.
Polling is often good enough, provided the polling operation is cheap, the number of clients is not large, and the added latency in client updates is acceptable. Something had gone wrong to make the cheap polling query become expensive, but only sometimes.

Vendor support was unfamiliar with the issue, and insisted on a familiar array of non-solutions:
"Install the latest version of our software."
What are the chances a major bug in the years-old version happens to have been fixed in the latest release? Sometimes there's a known issue and legitimate fix, but more often support is hoping the act of reinstalling will make the problem go away.
"Rebuild your database indexes."
It is generally not the case an index rebuild is needed to go faster. Fragmentation slows some queries, but in a gradual way unlikely to explain acute performance problems. It gets undue attention because it's a number reported in an interface, and you can make that number go down by running a script.
Unfortunately, a rebuild may appear to fix acute problems, because the rebuild and associated statistics update has the side-effect of invalidating cached query plans that were actually to blame. Once someone sees a query speed up after a rebuild, they are likely to think the rebuild did the magic and prescribe it as a fix in future situations.
At some point support departments for each of our four main applications insisted we rebuild to address performance complaints. This has never solved any problem; if your program is becoming unresponsive or reports take an hour to run that is because of poor programming choices, not general performance degradation.
"Add more memory."
Such a demand is especially frustrating - the entire database already fits in RAM! All pages were cached and SSMS reported zero physical reads by the query. Windows Resource Monitor confirmed no disk activity. More memory capacity could not be employed.
After upgrading, rebuilding, and doubling memory, nothing changed. Having escalated to the top tier of support, turnaround time for each diagnostic step was high, as few representatives exist at that level, with limited availability - detrimental to diagnosing intermittent problems.
One afternoon the issue had again gone away with a restart, as I had been looking at the query plan view. When I pulled up the plan again, the diagram struck me as slightly different. Fortunately I had taken a screenshot previously and was able to compare. From a distance, they looked similar, but on inspection the join order of the tables was reversed. It was soon clear what had gone wrong.
Image counting query plans
The below examples show the key difference between the fast and slow case.
Slow query plan

Fast query plan

Sometimes the filter step was rearranged, or the redundant second join of the image table eliminated. There are other problems with the query, but join order was determinative for the present issue.
Both plans give the correct answer. But one takes 350x as long to give you that answer, and requires 2,300x as many reads!
| Query plan | Time (ms) | Logical reads |
|---|---|---|
| Image table first | 231.20 | 464,539.03 |
| Study table first | 0.61 | 191.75 |
The difference was not for lack of indexes. All tables had indexes on ID columns to support joins, and every operation them. The image table had an additional index whose name indicated it had been added to support the polling query:
Integrator query index
CREATE NONCLUSTERED INDEX [IX_IntegratorQuery]
ON [dbo].[Visual] (
  [ModifiedDate],
  [VisualID],
  [SeriesID],
  [AcquisitionDate])
This index has ModifiedDate as its first column, enabling use
of a time point as an access predicate to search for images within a certain
interval. The SQL Server query plan refers to this operation as Index
Seek, but the Oracle term, INDEX RANGE SCAN, better
captures what is happening, and why the operation is used to support conditions
such as >= or BETWEEN. Per Markus Winand, "the biggest performance risk of an
INDEX RANGE SCAN is the leaf node traversal ... keep the scanned
index range as small as possible."
Finding images by time might be something you want to do, but the application never does. For the image counting query, the effect of a date index is to abet the query planner's choice of a regrettable join order: Find all images in the time range first, then discard those not belonging to the target patient.
Join order comparison

This illustration somewhat obfuscates algorithmic costs of each operation. Only the first range scan in either plan accesses a dense set of logically contiguous data. Subsequent steps are costlier as the join lacks a natural sort order; Each row requires a separate index tree traversal to seek to leaf data.
The slow query plan first uses the time point parameter to find all images in the database within a time range. The client is asking for the count of images since the most recent one it has seen. For a dental office, the time of your last x-ray is often six months ago. The scan by date collects half a year's worth of images - hundreds of thouands.
The database cannot know from looking at the Visual table alone
which images belong to the target patient. The schema's indirection places that
information two tables away. Each candidate image must be joined over to the
Study table containing the owning patient ID before it may be
discarded. At last, the tiny fraction of matching rows can be counted.
Advice on query plans mainly cautions looking for operations that don't use indexes. But fully indexed access can be slow when performed a million times for each query.
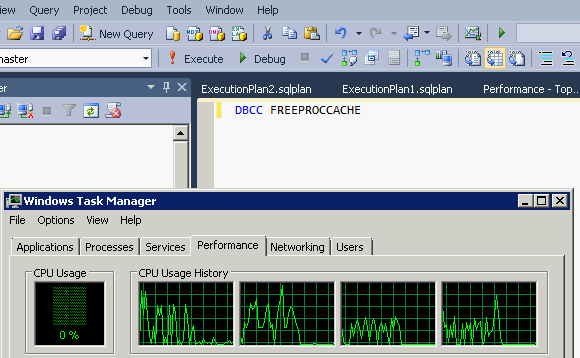
Restarting the server temporarily resolved the issue because a restart resets the cache of execution plans, giving the query a chance to be recompiled again, with the hope of a favorable alternative. Knowing the problem was a bad plan in the cache, I found a command to clear it without restarting the database; When tested, CPU load immediately fell. At least now there was a non-disruptive fix for when the issue arose.
Why does the query planner arrive at such a poor choice? It comes down to the information available to it.
Join order choice resembles classic combinatorial problems represented as a set of nodes, with connections varying in cost.
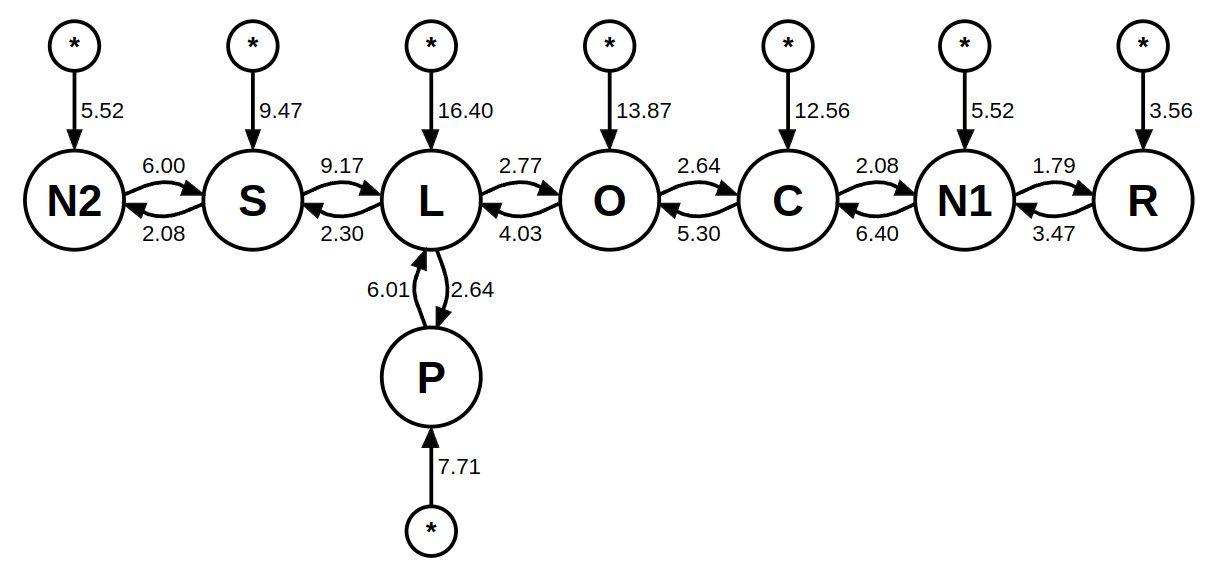
Join cost estimates from the SQLite query planner. Illustration from Richard Hipp
The objective is to find an economical path connecting all tables. This is a difficult problem by itself, made worse because costs differ between query executions and can only be estimated. The size of tables and their indexes are one influence easily observed. More opaque, but crucial for performance, are the distribution of table data, and of the values used to filter them.
The "width" of each set operation - the number of items processed - is termed cardinality, and key to query planning is cardinality estimation. When a query filters data, a goal is to reduce cardinality early in execution to avoid wasted work. Our particular query touches three tables and applies a filter parameter on two of them. We can say for sure we want one of those filters as our starting point, to immediately reduce the number of rows we're working with. But which to use?
If we pretend all records were in a single spreadsheet, a human performing the counting task intuitively knows to sort by patient first to narrow down the relevant rows, then look within that range for records in the target time window. A person does this without instruction because they possess tacit world knowledge about the distribution of the data:
Implicit world knowledge about x-rays
A human sees tables named patient and x-ray and applies cultural context, but the query planner sees lists of entities with no expectation of their distribution or relationship. Consequently it may choose plans a human knows are obviously wrong. To give the query planner more to work with, the server collects statistics about the distribution of table data. These consist of histograms of column values that allow estimating how much a filter value will narrow down a scan. It's not perfect information, and only applies to the first index column used, but is enough to avoid terrible plans.
Cardinality estimation applies a known key value to the table statistics, but what about parameterized queries - compiled once, then invoked with different arguments? Diverse arguments implies need for a model not only of table distributions, but the spectrum of expected arguments, resulting in a range of cardinalities. Unfortunately, SQL Server does not anticipate future arguments; instead it eagerly grabs whatever arguments are supplied when the query is first compiled, optimizes for them alone, and never revisits the question.
I later learned this behavior is termed parameter sniffing, and often blamed for database emergencies. There are methods for fixing it, but they assume you're the developer in a position to change the queries, not the end user of software from an obstinate vendor.
Poor optimization of parameterized queries is often discussed in the context of stored procedures (reusable code saved in the database). But the problem applies to any programming interface that provides a handle to a query that is compiled once and allows subsequent invocation with new arguments.
Why might query planning be inconsistent? Consider that although the
distribution of x-rays over time is uniform, patient files are not accessed
randomly. Conditional on viewing a given patient, the distribution of the
ModifiedDate query parameter is nonuniform:
Expected distribution of date last x-ray taken

If someone has your chart open, it is likely you just had x-rays taken, or are about to have them taken, and the newest ones are from your last appointment, about six months ago.
How things could go wrong: In the morning, after the system has been idle, the query is not cached. Someone opens a patient chart with recent images; Perhaps it is the billing office preparing insurance claims for yesterday's patients. The first polling query the server sees asks for images within the last day, a narrow range. A query plan is optimized for that favorable case and is stored in the cache. Subsequent users open charts for today's patients, with older images, causing a wider time range to be scanned. The polling queries back up until the server is doing nothing else and clients time out.
Unable to modify the application, or compel the vendor to fix it, I implemented the following production-quality solution:
Awesome workaround script
every five minutes:
  if CPU is high:
    empty_sql_proc_cache()
  else:
    do nothing
  log(time, cpu, action_taken)
  done
All I could do was watch the database to see if it chose a bad query plan, indicated by high CPU usage. This happened most days. When it did, the script told the database to empty its procedure cache, forcing generation of a new query plan, and a re-rolling of the dice. Within a few runs the query was optimized correctly, in time to prevent the load stacking up and disrupting users. The script's log confirmed the bad query plan caused load around 7:30 to 8:00 AM, and sometimes early afternoon.
The script was effective, but fragile. If the application were moved or reinstalled the script needed to come along with it, a requirement not obvious without having read documentation. The scheduled task invoking the script could fail if a service account password changed, or permissions were altered. (Password rotation reveals scripts hastily set up by admins under their own credentials.)
The workaround remained in place for several years until the company had switched to a different imaging solution as part of a cloud migration.
I later took the additional step of disabling the
problematic index on ModifiedDate that facilitated the range scan
on the image table. I was hesistant to make this change in case the vendor
later got bothered we had modified the database from stock. The fix could
also be reverted by a subsequent update.
Were I in a position to modify the application, better options exist. Deleting the problematic index likely worked, but what if that weren't possible?
Inconsistent performance from parameter sniffing can be prevented with dynamic SQL - write the query text anew each time, substituting the current arguments, and each is optimized separately, getting a bespoke query plan incorporating the specific data.
Dynamic SQL has costs, and can be frowned upon when used by default. It often betrays thoughtlessness - if you expect to do something repeatedly, communicate that in code. Overhead of dynamic SQL is maximized when short, frequent queries are re-compiled often. This imposes cost both in compilation time, and cache pressure from many plans potentially pushing other data out of memory.
These costs appear to discourage dynamic SQL for a polling query. But our scenario is more favorable, because each client queries one combination of [patient, date] repeatedly until the answer changes. Re-submitting the same query text doesn't require recompilation if the previous plan is cached. Thus the rate of query plan generation is proportional not to total polls-per-second, but the number of patients being viewed and how often their x-rays change, a smaller figure. The idle patient chart displaying a static patient requires only one unique query as long as it's open.
The problem could have been avoided if the client application refined its search window every poll to exclude ranges it already knows about. Suppose the query is run every five seconds. The first iteration might ask if images were added since six months ago. Five seconds later, there's no need to ask that same question again, because you already have the answer. If new data were just added it was in the past five seconds. With this change even a terrible plan only makes the first, more expensive poll slow.
A hurried programmer is unlikely to update poll ranges, as it is easier to use stateless designs lacking case handling. Careful treatment of first-load cases and updating variables between loops are common victims. Easier to set the same query to run every time and not re-examine it.
The client doesn't actually care about the ModifiedDate of
images; It's only used to see if a new image has been added. A simpler way to
achieve the same is counting all images for a patient regardless of date, then
seeing if the number has changed. The number of rows joined is identical,
with no unnecessary filter to confuse the optimizer.
The hasty programmer avoids counting for the same reasons as above - it requires storing a variable between polls and handling the first loop case differently.
If frequent polling of is required of infrequently-changing data, the computation can be done once and the answer stored. Caching can be done without changing tables by adding an indexed view. By itself, a view is just a prepackaged select statement and does not persist between queries. But, with some restrictions, indexes can be created on views, caching values in the index structure. Indexed views are commonly used to speed up aggregate functions, such as counts and sums, over many rows that change infrequently.
Materialized views vs. indexed views
SQL Server supports indexes on views. PostgreSQL supports materialized views, but not indexed views. Both cache view data but work differently.
A view index operates like a table index in that it affects performance, but not correctness. The index is kept in sync with the underlying view. Restrictions on what is permitted in a view index are in service of ensuring they can be cheaply updated with incremental changes. For example, an existing sum can ref.ect deletion of an underlying row by decrementing the total, but an average or maximum value cannot incrementally exclude a single input after they have been combined.
The materialized views of PostgreSQL work by saving the entire contents of the view at a given point in time. The update is all-or-nothing and saved data is not incrementally updated for you. Updates to the view require a command or trigger. The intended use is mass caching of data, possibly from sources external to the database; These are not useful for live updates.
More ambitious designs include getting rid of polling and adding a proper application server with publish-subscribe functionality.
Throughout diagnostics the vendor was insistent there could be no major problem with their software. Theirs was a familiar reply: "We're a market leader, with many large customers. Any problem would be obvious; You must be mistaken."
I'm not sure how many customers had installations of similar size, along with the software integration implicated here. But even if they existed and were impacted, would support have recognized the problem? When I mentioned the query issue to a different senior representative later, he had never heard of it. But I had told them about it earlier, as could have other customers who became frustrated and worked around the problem, or threw a faster server at it.
There exists a kind of organizational blindness where companies cease to acknowledge problems they are institutionally incapable of solving. At the same time, customers experience fatigue and stop bringing to the attention of support issues that have repeatedly gone unsolved. They make do and accept workarounds.
One of my goals in managing our growing dental chain was keeping all clinics on the same databases, and replacing solutions requiring overnight batch synchronization. A shared, live database has business value; Not only are there fewer systems to manage, but it offers patients the option to be seen at any office convenient to them. A customer could be examined in one office, their x-rays were immediately viewable by their regular doctor in a different location, and an offsite billing department could begin filing insurance claims with supporting documents without delay.
After we were acquired by a larger national company, I learned they had abandoned such efforts. Running into limitations with the leading applications - including their "enterprise" variants for multi-site use - they had broken up systems into small clusters with at most half a dozen clinics each. Clinics in the same town, remoting in to the same datacenter, were forced to use different databases, manually exporting data between them as needed. Such work complicated billing and reporting workflows.
These pains are unlikely to be fixed, as on-premises medical software for smaller businesses is a "legacy" product category. That the same vendors now offer browser-based SaaS products signals a limited life for applications rooted in 1990s PC software.

Not the imaging software in this article.
Why is that index there, anyway?
Why would a developer add an index that could only harm the intended query? Support documents offer a clue - Screenshots of the application show clean installs with few patients. I suspect the program was untested on large customer data.
With few patients, the planner has a biased view of parameter selectiveness, and may choose to scan the image table first. A developer, balking at a table scan, might have added an index supporting the image table access. Doing so reinforced a poor query plan that grew costly as the database expanded.
More about that bad query
Our focus has been the join order issue, but the application is full of basic mistakes. Look again at this query:
WITH
  PatientVisuals as (
    SELECT
      Visual.VisualID as VisualID
    FROM
      visual,
      study,
      series
    WHERE
      Visual.RemovedDate is NULL
      AND study.PatientID     = @patientID
      AND study.StudyRecordID = series.StudyRecordID
      AND series.SeriesID     = Visual.SeriesID
  )
SELECT
  COUNT(1)
FROM
  Visual,
  PatientVisuals
WHERE
  Visual.VisualID = PatientVisuals.VisualID
  AND Visual.ModifiedDate > @ModifiedDate
Note the redundant table access used to apply two filter predicates
The PatientVisuals CTE makes no sense as an organizing tool for
this query - because it wasn't written here; It was copied from somewhere else
where "select all image ids for a patient" was needed.
The author, unfamiliar with SQL or the particular schema, lifted a magic
chunk of code from elsewhere. Because the expression didn't collect all
columns necessary for the new query, they left the magic part untouched and
added a redundant join on the Visual table to apply the
ModifiedDate filter at the end.
The result is less readable and hard to optimize. Even with the faster join
order, the query planner did not reliably eliminate the redunant second join,
going back to pick up one more piece of information (ModifiedDate)
that it already had within reach during a previous table access.
Teaching about indexing and performance
Learning material on performance emphasizes adding indexes and ensuring they are used. Readers are encouraged to "trust the optimizer" and supply it with more tools to do its job. To the extent trade-offs are discussed, it is regarding time and space overhead of the index itself. Rarely mentioned are cases where a query plan benefits from an index being removed.
Consider O'Reilly's High Performance MySQL chapter on Query Performance Optimization:
Disabling an index is suggested in only one situation, to address a MySQL limitation concerning index merge algorithms.
I aim not to pick on one book, but to note that even in a comprehensive textbook, the lesson is to approach performance problems with a mindset of where to add indexes in support of the query planner.
Why is this still a problem?
The issue of parameterized queries needing to handle a range of future values is long known. Academic literature contains many ideas to address the problem that appear disused.
Multiple plans
One paper suggests generating multiple execution plans for a query, for different ranges of parameter values. Each execution selects a plan suitable to the argument provided.
The number of additional plans required could be low as databases benefit from simple dichotomized threshold optimizations, falling back to an alternate strategy when a cost estimate exceeds some value. This reflects the experience of unevenly distributed cases; The common case examines a few thousand rows, the worst touches millions.
Query instrumentation
Another publication suggests instrumenting key steps in the execution plan with performance counters. These could be compared to expected values in the plan. During execution, if cardinality were far higher than anticipated, the query could be recompiled and a better strategy selected.
SQL Server already records expected vs. actual row counts - it just doesn't use the information automatically to improve plans when large disparities arise. Developers have written scripts using these metrics to automatically detect probable cases of parameter sniffing causing poor plans; These can be selectively removed from the cache.